- The browser will normally not display anything to the user indicating something is wrong
- Most browsers have a mechanism to view JavaScript errors (in Chrome, use Ctrl-Shift-J to see the JavaScript Console)
- Deciphering the reported errors takes some getting used to
- JSLint can be helpful at catching some bugs
- All browsers contain a log which developers can use to view debugging statements from their code
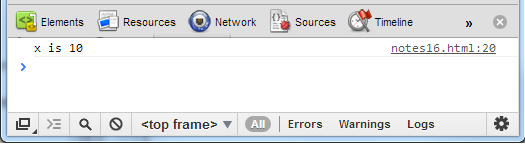
- Output to the log using
console.log(message)var x = 10; console.log("x is " + x); - See log output in Chrome's JavaScript Console (Ctrl-Shift-J)
-
Other methods include
console.error(),console.warn()and others - Learn more: Tips and Tricks for using Chrome's console
- Use the
alertfunction to pause execution
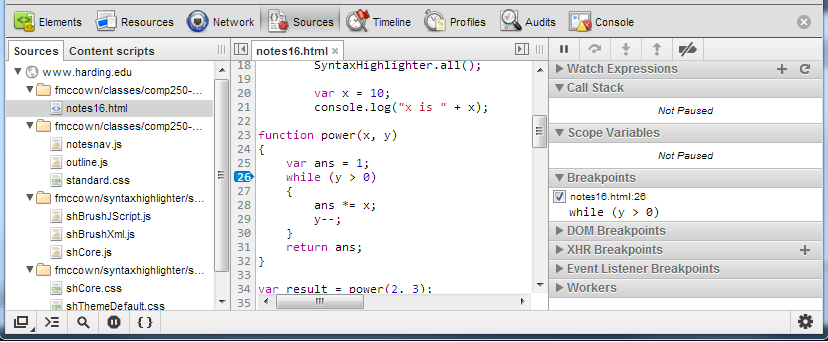
- Open the Chrome developer tools by pressing Ctrl+Shift+I
- Select Sources tab, and select the file that contains the JavaScript you want to debug on the left
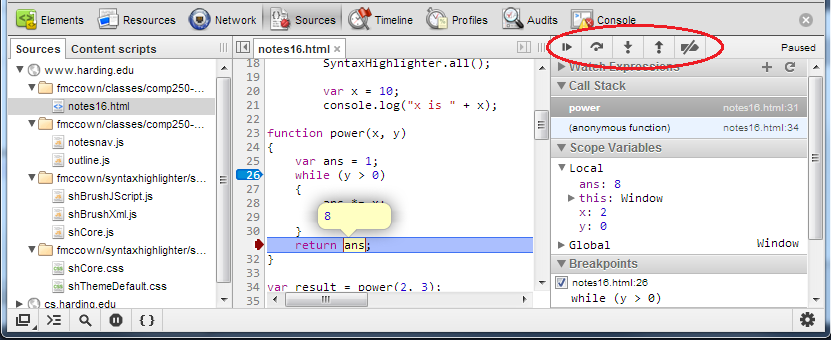
- Set a breakpoint by clicking on an executable line number (a breakpoint
was placed on line 26 below
- When the line of JavaScript containing the breakpoint is about to be executed,
the browser will pause. You can step through the code using the buttons circled
(F10 to step over, F11 to step into, F8 to continue execution) and examine
variables by putting the mouse cursor on them or observing their values on the pane on
the right